More Examples
Here you can see Spec work, marketing work, published and unpublished data, Grant and fellowship figures, student work, outreach material, educational content, and data graphics. Note that many of these images are web optimized, and therefore not full resolution. Full resolution images are available upon request.
Quandary Studio has Expertise with several graphic and media tools, including 3D Studio Max, Illustrator, Photoshop, Premiere, and others. In addition, Quandary Studio is skilled in the use of scientific tools, including R and ImageJ, as well as several other proprietary software packages, such as big data tools like Ingenuity Pathway Analysis and DICOM viewers for medical images. We can move fluidly between them and present scientific, medical or other data in an engaging and clear way.
Upon request, we can keep precise notes to allow for reproducibility, if necessary. We are also able to present data in a way that is accessible to individuals with deuteranopia and other forms of color-blindness, or to manipulate existing images to be compatible in this way. We're Able to meet your publication guidelines for size and resolution.
In addition to the work presented here, Quandary Studio works with independent contractors, many of whom have impressive portfolios of their own. If you're interested in working with Quandary Studio, please visit the contact page.

Visualization of Kambin's Triangle, the target for many spine surgeries originating obliquely.

Spec work. Proposal to outline five molecular mechanisms in one illustration.

3D representation of actin in complex with tropomyosin and troponin.

A stylized depiction of the major elements in a nucleus.

Overview of PDE4DIP in the NMDAR-mediated PKA pathway. 3D scene rendered in 2D graphic illustration style.

Spec work. The role of bacteria in inflammation-driven pain, as mediated by the signaling molecules.

Brains in the rodent and primates lineages scale differently in size and neuron number across species. This illustration is meant to quickly communicate this difference.

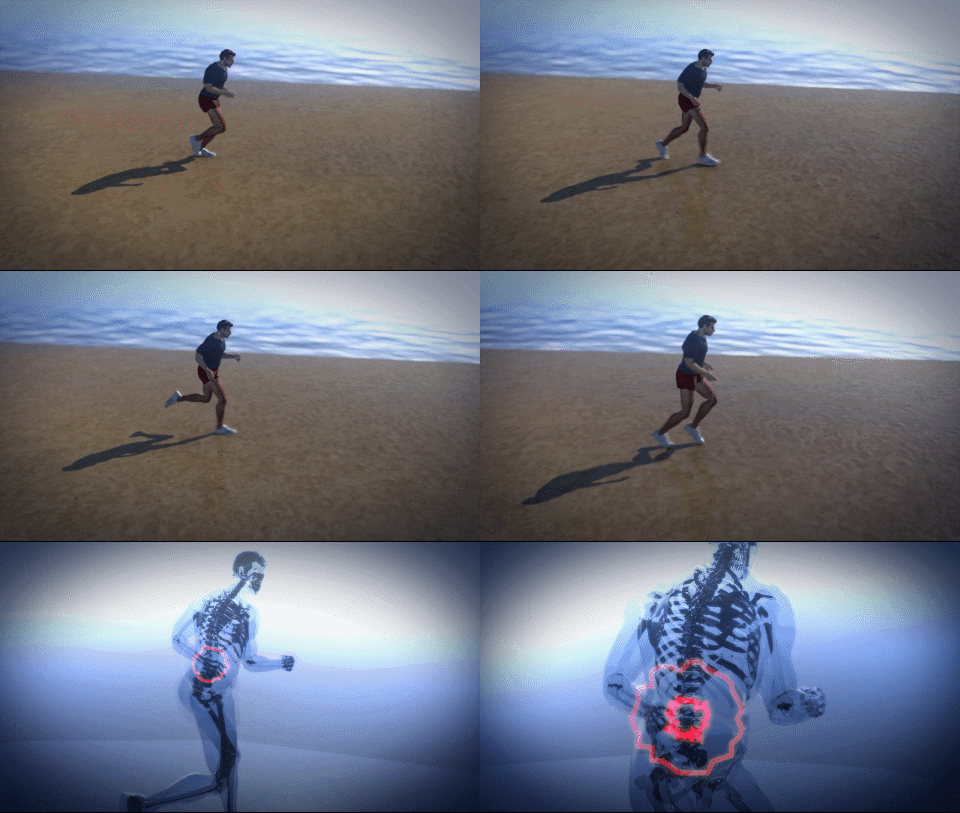
Halted project. Introduction to an educational surgical animation.

Oligodendrocytes. Unpublished data. Used for artistic purposes.
Outreach, Education, Marketing and Spec Work
7 images

Data graphic. The copy number of the "DUF1220" protein domain has been linked to brain size. Neurons in this image were procedurally generated in number and overall sphere size to reflect the copy number found in the genome of the indicated primate species.

Data table used to generate previous data graphic. Calling attention to the striking copy number difference of the DUF1220 sequence in primates.

Assembly and animation of millions of data points to display the most interesting portion of the human genome. Used in talks and web images.

Synthesis of developmental milestones in human brain development. Used in a publication.

High throughput sequencing experiment. Professor P. asked for a way to simultaneously show how well his coverage mapped to his probes, and how comparatively small probe coverage was when compared to repeat elements. This graphic was used in presentations.

Visual way to synthesize many brain size measurements, with neuron number on the X axis and brain mass on the Y axis. Quickly explains why primates cognitively outperform rodents of similar brain size.

Perl, R and 3ds Max were used to visualize amperage demand over time.

Custom script used with online genomic mapping tools to visualize the genomic positions of 5 different, color-coded elements. The regularity of these different elements with respect to each other is remarkable when presented in this way.

Many data points in several conditions are summarized in one image.
Data Visualization
15 images

Proposed mechanism under investigation.

Pretest for optimal working conditions: in situ hybridization probe tests. Brightfield, unmodified images.

Publication explanation of analysis pipeline. Graphic simultaneously shows qualitative data side by side and region used in quantification.

Timeline of gene expression in the developing human brain.

Pretest for optimal working conditions: cell culture blocking solution.

Immunocytochemistry evaluating two different conditions in cell culture.

Cell culture evaluated at two conditions. Inset image shows relative brightness of right image when imaged at the same exposure as the left image.

Part of an effort to increase copy number of a specific domain, part 1: construct design.

Part of an effort to increase copy number of a specific domain, part 2: strategy.
Grants and Publications
13 images

Objective presentation of two mouse littermates for phenotypic comparison.

Visually highlighting where neurons were found procedurally.

Localization of an in situ hybridization probe in the ventricular zone of the developing human brain. This is where neurons are born.

Summary graphic combining several hundred images of sagittal mouse sections. Broad scale approach maintains context, but still allowed researchers to zoom into crisp detail. Each section is stitched together from many scans into one contiguous image.

Green seems to form a protective sheath around dividing cells!

Localization of a new antibody to the neural cytoplasm.

Juxtaposition of the telencephalon (front) and diencephalon (middle) of the developing brain.

Screening for undesirable conditions.

Comparison of the developing neocortex in two different lines of mouse.
Miscellaneous and Unpublished
16 images

Storyboard sketches.

Storyboard sketches.

Storyboard sketches.

Storyboard sketches.

Storyboard sketches.

Storyboard sketches.

Storyboard sketches.

Storyboard sketches.

Production pipeline. Actual image, virtual reconstruction, and sketch.
Personal and Storyboard Artwork
18 images
